Light Pollution
Light Pollution
- Street Lamps spectra
Light Pollution at Campo dei Fiori Observatory
Photometry of sky background is without any doubt the fastest and more precise method to assess how dark is an astronomical
site. But spectrometry can add informations on the spectral distribution and relative importance of the sources of sky
brightness, both artificial and natural.
In this page we present results on the first measurement of the sky darkness at our site based on spectroscopic
observations of 20th Feb 2003.
Picture 1 shows a sky spectrum recorded 45 degrees hight over the SE horizon and many lines are identified as coming from
different types of street lamps or from natural atmospheric sources.
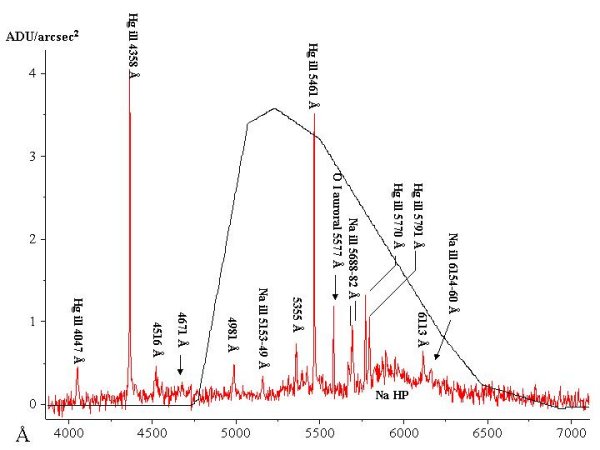
Picture 1: Sky backgroud spectrum recorded with 5 Ĺ resolution with 2x10 min exposures (for each one of the three
spectral regions 3800-5000, 5000-6000 and 6000-7000 Ĺ). Wavelength calibration has been done with a Ne lamp.
CCD Dark images were obtained with 3x10 min exposures. The Y axis shows the ADU unit measured and normalized for
squared arcsec. It is also shown the spectral curve of a V photometric filter. As can be seen, many of the more intense
polluting bands lie within the range of the V filter.
This spectrum has been recorded on 20th Feb 2003 between 20 and 22:30 TU with thick mist covering a large lower part of the
plain that lies under the mountain where is located the observatory.
The telescope (60 cm F/20) was left fixed and directed 45 hight over the SE horizon (that is the more polluted because
in this direction can be seen the huge urban Milan agglomeration) and far from the milky way, roughly in the
Leo constellation. HR was 45%, T=-2°C and the sky was without any cloud.
Campo dei Fiori Observatory is particularly interesting in monitoring spectral distribution of light pollution because it is
located on a small mountain 1226 m hight just in front of Padana plain. Milan is only 50 Km away (see picture 2) in SE
direction while international Malpensa airport is 25 Km away on SW direction. On Est and NE can be seen the halo of Lugano
and Como agglomerations while the W to NE horizon looks towards the darker Alps valleys.
We hope to help monitoring spectroscopically the evolution of light polluting sources as technology changes because of the
laws concerning light pollution that we have in our region (Lombardia).
It is difficult on the other side to make a good measurement of the sky magnitude because it changes a lot as a function
of thermal inversions that concentrate (expecially during winter) on the plain the haze and the fog, shielding more or less
the polluting light. This make us the gift of the darker nights.
Nevertheless, for this particular day, we integrated the CCD counts between 4000 e 7000 Ĺ and compared them with
Procyon spectrum obtained in 1 sec with all open slit while the star was 45 degrees hight.
Magnitude difference was calculated with the formula DM=2.5xLog(Counts Procyon/Counts Sky)
where the log is base 10. Summing up this value with the magnitude of Procyon, one can obtain an estimate of the sky magnitude.
Our result is Msky=19.8 for each squared arcsec. The result is slightly worse if one consider only the V
band where the magnitude Msky=19.4.
These values were obtained at 45 degrees height. A quick look at the Zenith sky spectrum restricted to the 4500-5800 Ĺ region,
showed that here the sky is about one magnitude darker.
It must be stressed out, however, that our results were obtained during a good winter night when dense mist was covering the plain
thus masking the light that is scattered out from there. During summer we expect to have a brighter sky.
For comparison, the sky brighteness due only to natural luminescence is around 22.
Human contributions to the sky brightness, as shown in the spectrum of picture 1, are expecially due to the mercury street lamps
(the most bright lines) and to the High pressure sodium lamps that produce some small lines but also a broad continuum from
5200 to 6200 Ĺ that is weak but when integrated it can give a big contribution tho the overall luminosity.
Contribution from low pressure Na lamps seems to be negligeable because the yellow doublet at 5890-90 Ĺ cannot be seen.
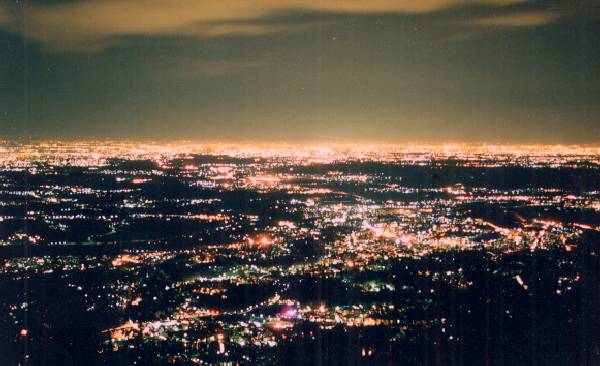
Picture 2: The Padana plain as can be seen fron Campo dei Fiori during a clear night with North wind.
(photo Andrea Aletti).
Spectrum of picture 1 shows one only line due to the atmosphere at 5577 Ĺ. This line is due to the recombination of three
Oxygen atoms that form an O2 molecule plus an excited O atom that decades emitting the 5577 Ĺ line.
This reaction reaches its maximum rate at a height of around 90 Km because the presence of atomic oxygen is caused
by solar UV's that start to be absorbed at lower altitude.
Oxygen can produce also a second group of red lines (at 6300 and 6364 Ĺ) at an altitude of about 300 Km (this altitude is also the
higher limit for 5577 Ĺ line production)
The emission of red lines follows the impact between a ionized Oxygen molecule with a free electron that create two excited O atoms.
These atoms decay emitting red and green lines.
In the red and IR part of the spectrum of the night sky, can be observed a lot of bands due to OH (Meinel bands).
Production of free OH follows from the reaction H+O3 --> OH* + O2*, where * means excited.
H atom is then re-formed by the reaction OH+O --> H+O2. In any case these lines are not visible in our spectrum,
probably because they were too weak to be detected.
For people who wants to know more about light pollution I suggest
The Web Page of Dr Cinzano, Padua Observatory astronomer that collected there everything about light pollution.
|
|