THE SPECTRA OF NOVAE AND SUPERNOVAE
Spectroscopic evolution of Nova V2362 in Cygnus
This nova has been discovered on April 2.8 2006 by H. Nishimura, (IAU Circular 7975) in Cygnus
when it rised at 8th mag.
The nova position is (equ 2000.0): RA = 21h11m32.34s - DEC = +44°48'03.9".
Our observatory contributed the classification of this nova with early spectra on 8th and 12th April
in collaboration with astronomers at Asiago Observatory (IAUC 8702 April 13).
Possible progenitor with Halfa emission was find on plates recorded with
Isaac Newton telescope and show that the amplitude of the nova outburst should be about 12 magnitudes.
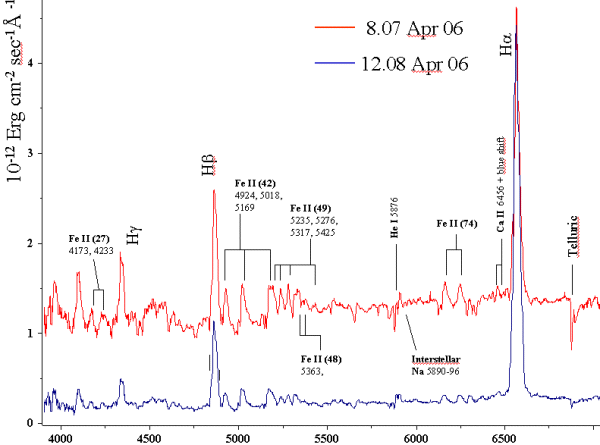
Our recorded spectra on 8th April showed strong hydrogen Balmer lines and prominent Fe II emission ot the multiplets
27, 37, 38, 42, 48, 49 and 74 in addition to 'auroral' OI lines at 5577,6301,6364 Ĺ, not present on 8th apr but
appearing 4 days later and reaching maximum intensity one month later (picture 2).
Hydrogen balmer emission lines were shifted about 100 Km/sec toward the blue and two weaker absorptions were present
at RV=-870 and -1900 Km/sec. Almost the same shifted double absorptions were shown by Ca II and He I lines.
|
Picture 1: Spectra of the nova V2362 Cyg recorded on 8th April 2006 (3 x 5 min exposure) compared with 12th April 2006 (3x10 min exposure).
Cassegrain 0.6 m telescope (P. Valisa and Angelo Stanzione) and spectrograph working at 1.7 Ĺ/pixel dispersion.
|
|
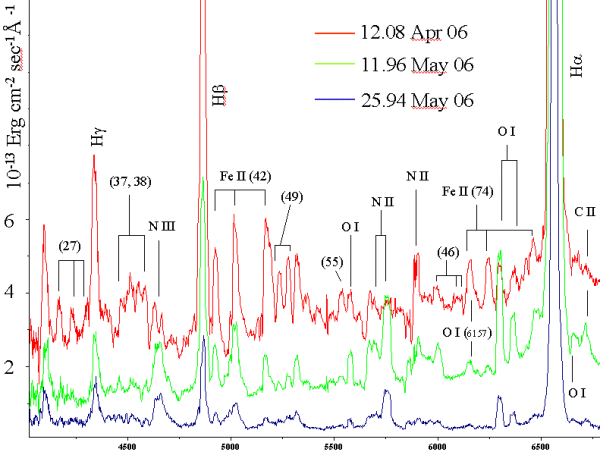
Picture 2: Evolution of spectra of the nova V2362 Cyg during the first 50 days after discovery. All spectra recorded with 60 cm telescope at
1.7 Ĺ/pixel dispersion. Exposure time 1800 sec (12-04), 5400 sec (11-05) and 6300 sec (25-05)
|
Follow up spectra are shown in picture 2 and picture 3. From the 11th may it appears also NIII 4634-4640 Bowen
fluorescence and maximum intensity of Balmer emission lines seems to shift 5 to 7 Ĺ to the red.
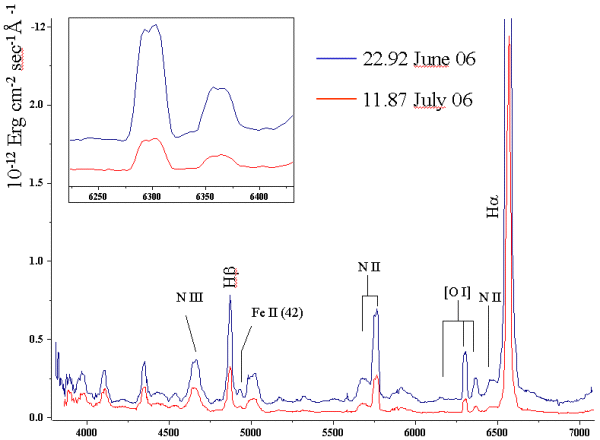
Picture 3 shows nova spectra 80 and 100 days after outburst. Profile of NII and OI lines is doubled with central absorption shifted at RV about -200 Km/sec
and emissions at -400 Km/sec and +130 Km/sec.
|
Picture 3: Evolution of spectra of the nova V2362 Cyg from 80 to 100 days after discovery. All spectra recorded with 60 cm telescope at
3.5 Ĺ/pixel dispersion. Exposure time 5400 sec.
|
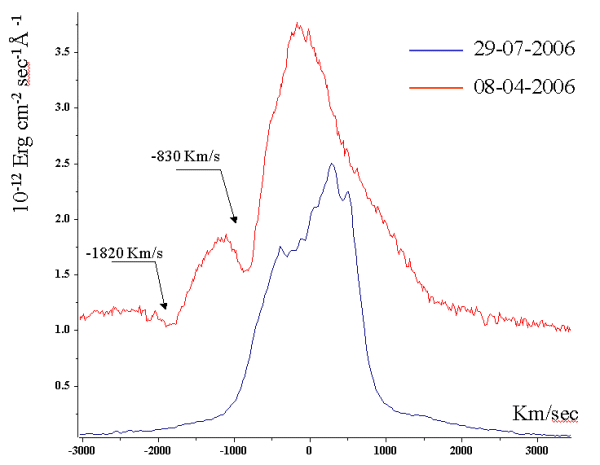
On July 29.95 UT we recorded again high resolution spectra of H a and [O I] spectral region and compared them to
analogous spectra recorded close to outburst (8th april 2006).
H a profile on 8th april showed two absorptions at Rv= -830 Km/sec and -1820 Km/sec while on 29th July some emission
peaks emerges atop the large emission feature. These emissions are both blue and red-shifted.
|
Picture 4: Evolution of H a emission line of V2362 Cyg. Exposure: 1200 min on 8th april (0.35 Ĺ/pix), 5400 sec
on 29th april (0.7 Ĺ/pix).
|
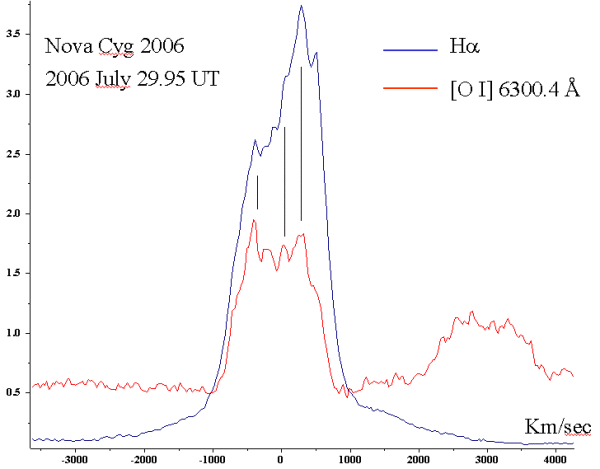
Emission line profiles of H a and [O I] 6300 Ĺ overlapped, both corrected for earth diurnal and orbital motion show mainly
the same peaks, even if with different intensities. Only one peak at RV=-140Km/sec is present in H a but not in [O I].
A larger, weak and much broader absorpion is perhaps present underlying [O I] emission with a FWHM of some 6000 Km/sec. Higher S/N spectra
are needed to confirm this.
|
Picture 5: H a emission profile compared to [O I] emission profile. Intensity of [O I] line is multiplied by 10.
|
|
|