SPECTROGRAPHS AND RELATED TOPICS
Spectrograph -
Entrance Optics -
CCD ST-10
- Atmosphere
- Flexure tests
- Ref Lamps
A new CCD ST10XME
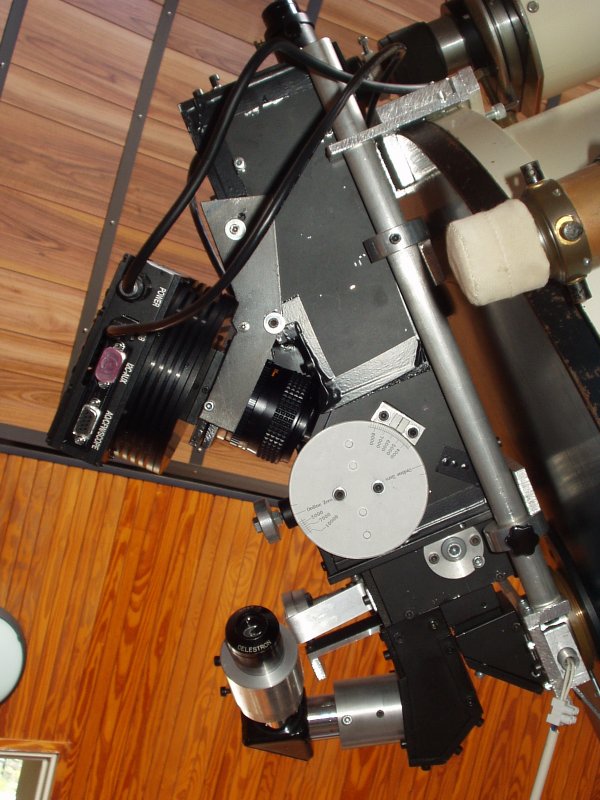
During July 2005 our old CCD MX512 has been upgraded to a more efficient ST10XME.
The picture below show the mechanical assembly of the new CCD, much bigger than the previous one. In particular it was necessary
a regulation to correct for the possible small tilt of the focal plane onto the large sensor (14 mm long, 2048x1472 square pixel size 6.8 mm).
The focusing camera is a 50 mm f 1.4 photographic lens and gave onto the new detector a dispersion of 1.7 Ĺ/pixel with 600 l/mm grating
and 0.35 Ĺ/pixel with 1800 l/mm grating.
The covered spectral field is enormously increased. With the 1.7 Ĺ/pixel dispersion the full 3800 to 7500 Ĺ can be recorded with one shot.
|
|
Picture 1: The new ST10XME installed onto our spectrograph.
|
Characterisation of CCD ST10XME
Here on we collect some experimental data concerning our CCD. These information are necessary to correct raw spectra in order to
obtain data of scientific value
BIAS

|
|
Picture 3: False colour Bias image at -24°C. The first 300 columns have value greater than average.
Median filter of 3 images. Smoothed.
|
|
|
Picture 4: Bias level at different rows on CCD is fairly the same.
|
|
|
Picture 5: Unfortunately, the bias level seems to change with temperature of the chip and from day to day (-5 and -24 bias were
collected on the same day (very dry - RH=10%) while -18 bias was collected one week before when RH=80% (quite wet).
The curves represent the profiles along the long axis of CCD averaged for the 1472 rows.
Another possibility, to test, is that bias collected with CCDOPS (min exposure 0.1 sec) or CCDSoft can be different. Infact CCDSoft
marks in the header that the exposure time is one sec. What does really do such software? -18 bias was recorded with CCDOPS while
-24 and -5 bias were collected with CCDSoft that has a specific choice BIAS.
|
|
|
Picture 6: Bias level is a little periodic within the image, but the pattern is shifted from image to image.
|
Readout Noise
Readout noise was measured as standard deviation of Bias image inside a 5x5 pixel box. For each image we performed 10 such measures
and then averaged. The results that we obtained are: 5.1 Counts @ -24°C, 5.1 Counts @ -18°C and 4.3 Counts @ -5°C.
Dark Current
Different tests were performed on dark current. Thermal motion can create in CCD hole-electron pairs that are indistinguishable from
photoelectrons. Dark current of course decreases quickly with temperature.
|
|
Picture 7: Average dark current per pixel each minute at different temperauture of the CCD. Instability of Bias can be the cause
of the bad point corresponding to -12°. The two curves are obtained applying two different bias. Theyr difference is 0.4 count/pixel
on the average. Such small instability can cause problems on repeteability of Dark frames.
|
|
|
Picture 7b: Dark current at the hot pixel (X=59 Y=136) as a function of temperature. Higher counts decrease the effect of bias
instability. Dark current is divided by two when temperature is decreased by 8 degrees.
|
|
|
Picture 8: Subtraction of two dark frame (each median of 3 x 5 min dark exposures at -18°). The first series of dark frames was recorded
the 23th October 2005. The second series was recorded the 12th november 2005.
|
|
|
Picture 9: Result of previous subtraction. Average value over the whole 1472 lines of the CCD is around zero as expected.
|
|
|
Picture 10: Dark current as a function of exposure time (from 1 to 900 sec). For the average of pixels dark current is extremely low
at short exposures and bias uncertainties become very important. For hot pixels linearity with time holds but for the highest pixel of the CCD saturation
effect or persistence of charge at low temperature (tests done at -24 °C) gives some non-linearity. Note that the graph is a log-log to
include the high dinamic range between hot and normal pixels.
|
Flat Field
Flat field has a different meaning in imaging and spectroscopy. In spectroscopy a uniform image obtained with a continuous spectral source
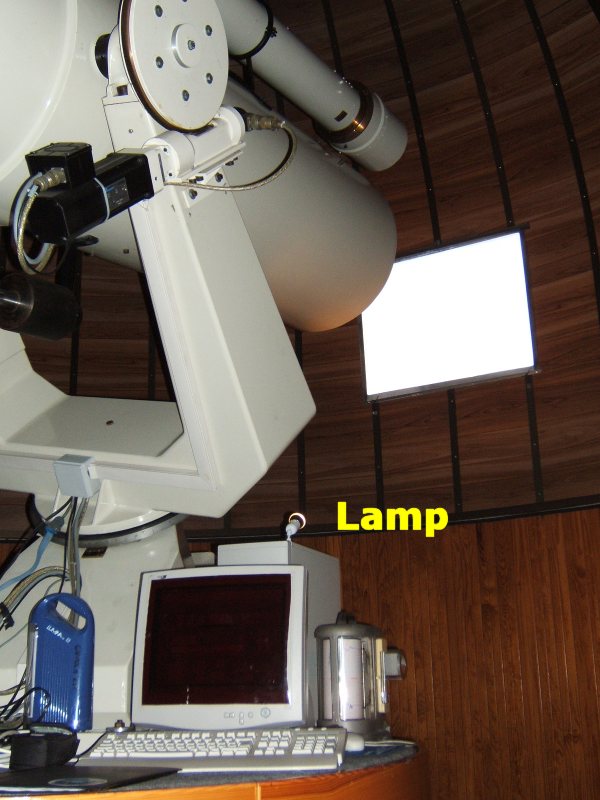
(like an halogen lamp) is imaged throught the slit along spectrograph onto the detector. The result is shown in image 11. We use a 25 W
halogen lamp 3 meters away from a white reflective sheet (1m x0.8m) that is at 1.5 meters in front of the telescope tube. It produces a fairly
uniform source all across the entrance pupil of the telescope.
Dust onto the slit and slit imperfections produce dark horizontal lines where sensitivity is decreased.
|
|
Picture 11a: Lamp and reflective panel set up for acquisition of flat field.
|

|
|
Picture 11: Flat image obtained at 1.7 Ĺ/pix dispersion, slit 70 mm. 3500 Ĺ is at the left of the image, 7100 Ĺ is at the right end.
Dark lines due to dust particles onto the slit can be seen. As well, not perfect parallelism of the slit blades gives a higher
illumination at the bottom of the image.
|
|
|
Picture 12: A blue filter was added to the halogen lamp, in order to help in recording a good flat also in the blue region.
With this filter at 4500 Ĺ is observed a 25% increase of light when maximum of emission is normalized. A stronger filter or a double
filter could perhaps give better results.
|

|
|
Picture 13: Image of the corrective value to be applied to the science image in order to correct for pixel to pixel sensitivity
difference and irregularities of the slit or vignetting of spectrometer optics. Average value of the image is 1.
|
Exposure stability. Shutter.
Two kind of tests were performed in order to know which is the minimal exposure that can be used with our CCD.
We measured uniformity of illumination at short exposure time and signal fluctuation from exposure to exposure
due to fluctuation of exposure time.
Non uniform field illumination is less than 3% for 1 sec exposure (compared to 10 sec exposure), while it rises to 6%
when the exposure is shortened to 0.1 sec.
|
|
Picture 12: White lamp spectrum at high dispersion (1800 l/grating) for 0.1 sec, 1 sec and 10 sec exposure time.
Each of the 1 sec and 0.1 sec is obtained with median filter of 9 exposures.
|
Non uniform field illumination is less than 3% for 1 sec exposure (compared to 10 sec exposure), while it rises to 6%
when the exposure is shortened to 0.1 sec.
A bigger problem is that exposure time is shorter than it should be, probably due to lack of sincronisation of the
mechanical shutter with the electronic readout time, as thermal current scales correctly with exposure time.
The graph below shows that with 100 sec exposure we measure 130'100 counts on a particular line of Ne lamp, but we measure
only 12'850 counts (1.3% less than 13100, as it should be) with 10 sec and 1047 with 1 sec instead of 1310 (19.6% less).
|
|
Picture 13: Signal produced by our Ne Lamp as a function of exposure time from 0.1 to 100 sec. Short exposures
result shorter than they should be.
|
Following table resumes the correction to counts in order to bring them at the nominal exposure time:
| Exposure |
Percentage correction to add. |
| 100 sec |
0% |
| 50 sec |
0% |
| 20 sec |
0.9% |
| 10 sec |
1.3% |
| 5 sec |
4.5% |
| 2 sec |
10.3% |
| 1 sec |
19.6% |
| 0.5 sec |
23.7% |
| 0.2 sec |
24.7% |
| 0.1 sec |
39.0% |
First Light
First light on July 2005 allows us to participate to the international spectroscopic monitoring of Beta Lyr. Here is an example of the recorded spectra.
|
|
Picture 14: Spectra of Halfa and He I region recorded with 1800 l/mm grating and CCD ST10 XME.
|
|
|